📦 View Artifacts
Each time you execute a workflow in Nota AI, it generates artifacts that capture what happened during the test.These artifacts help developers and QA teams debug, analyze, and share results more effectively. You’ll get:
- Test case code — the generated automation script
- Task breakdown — a step-by-step view of what happened
- Video and GIF recordings — to visually verify test execution
- Downloadable trace archive (
trace.zip)
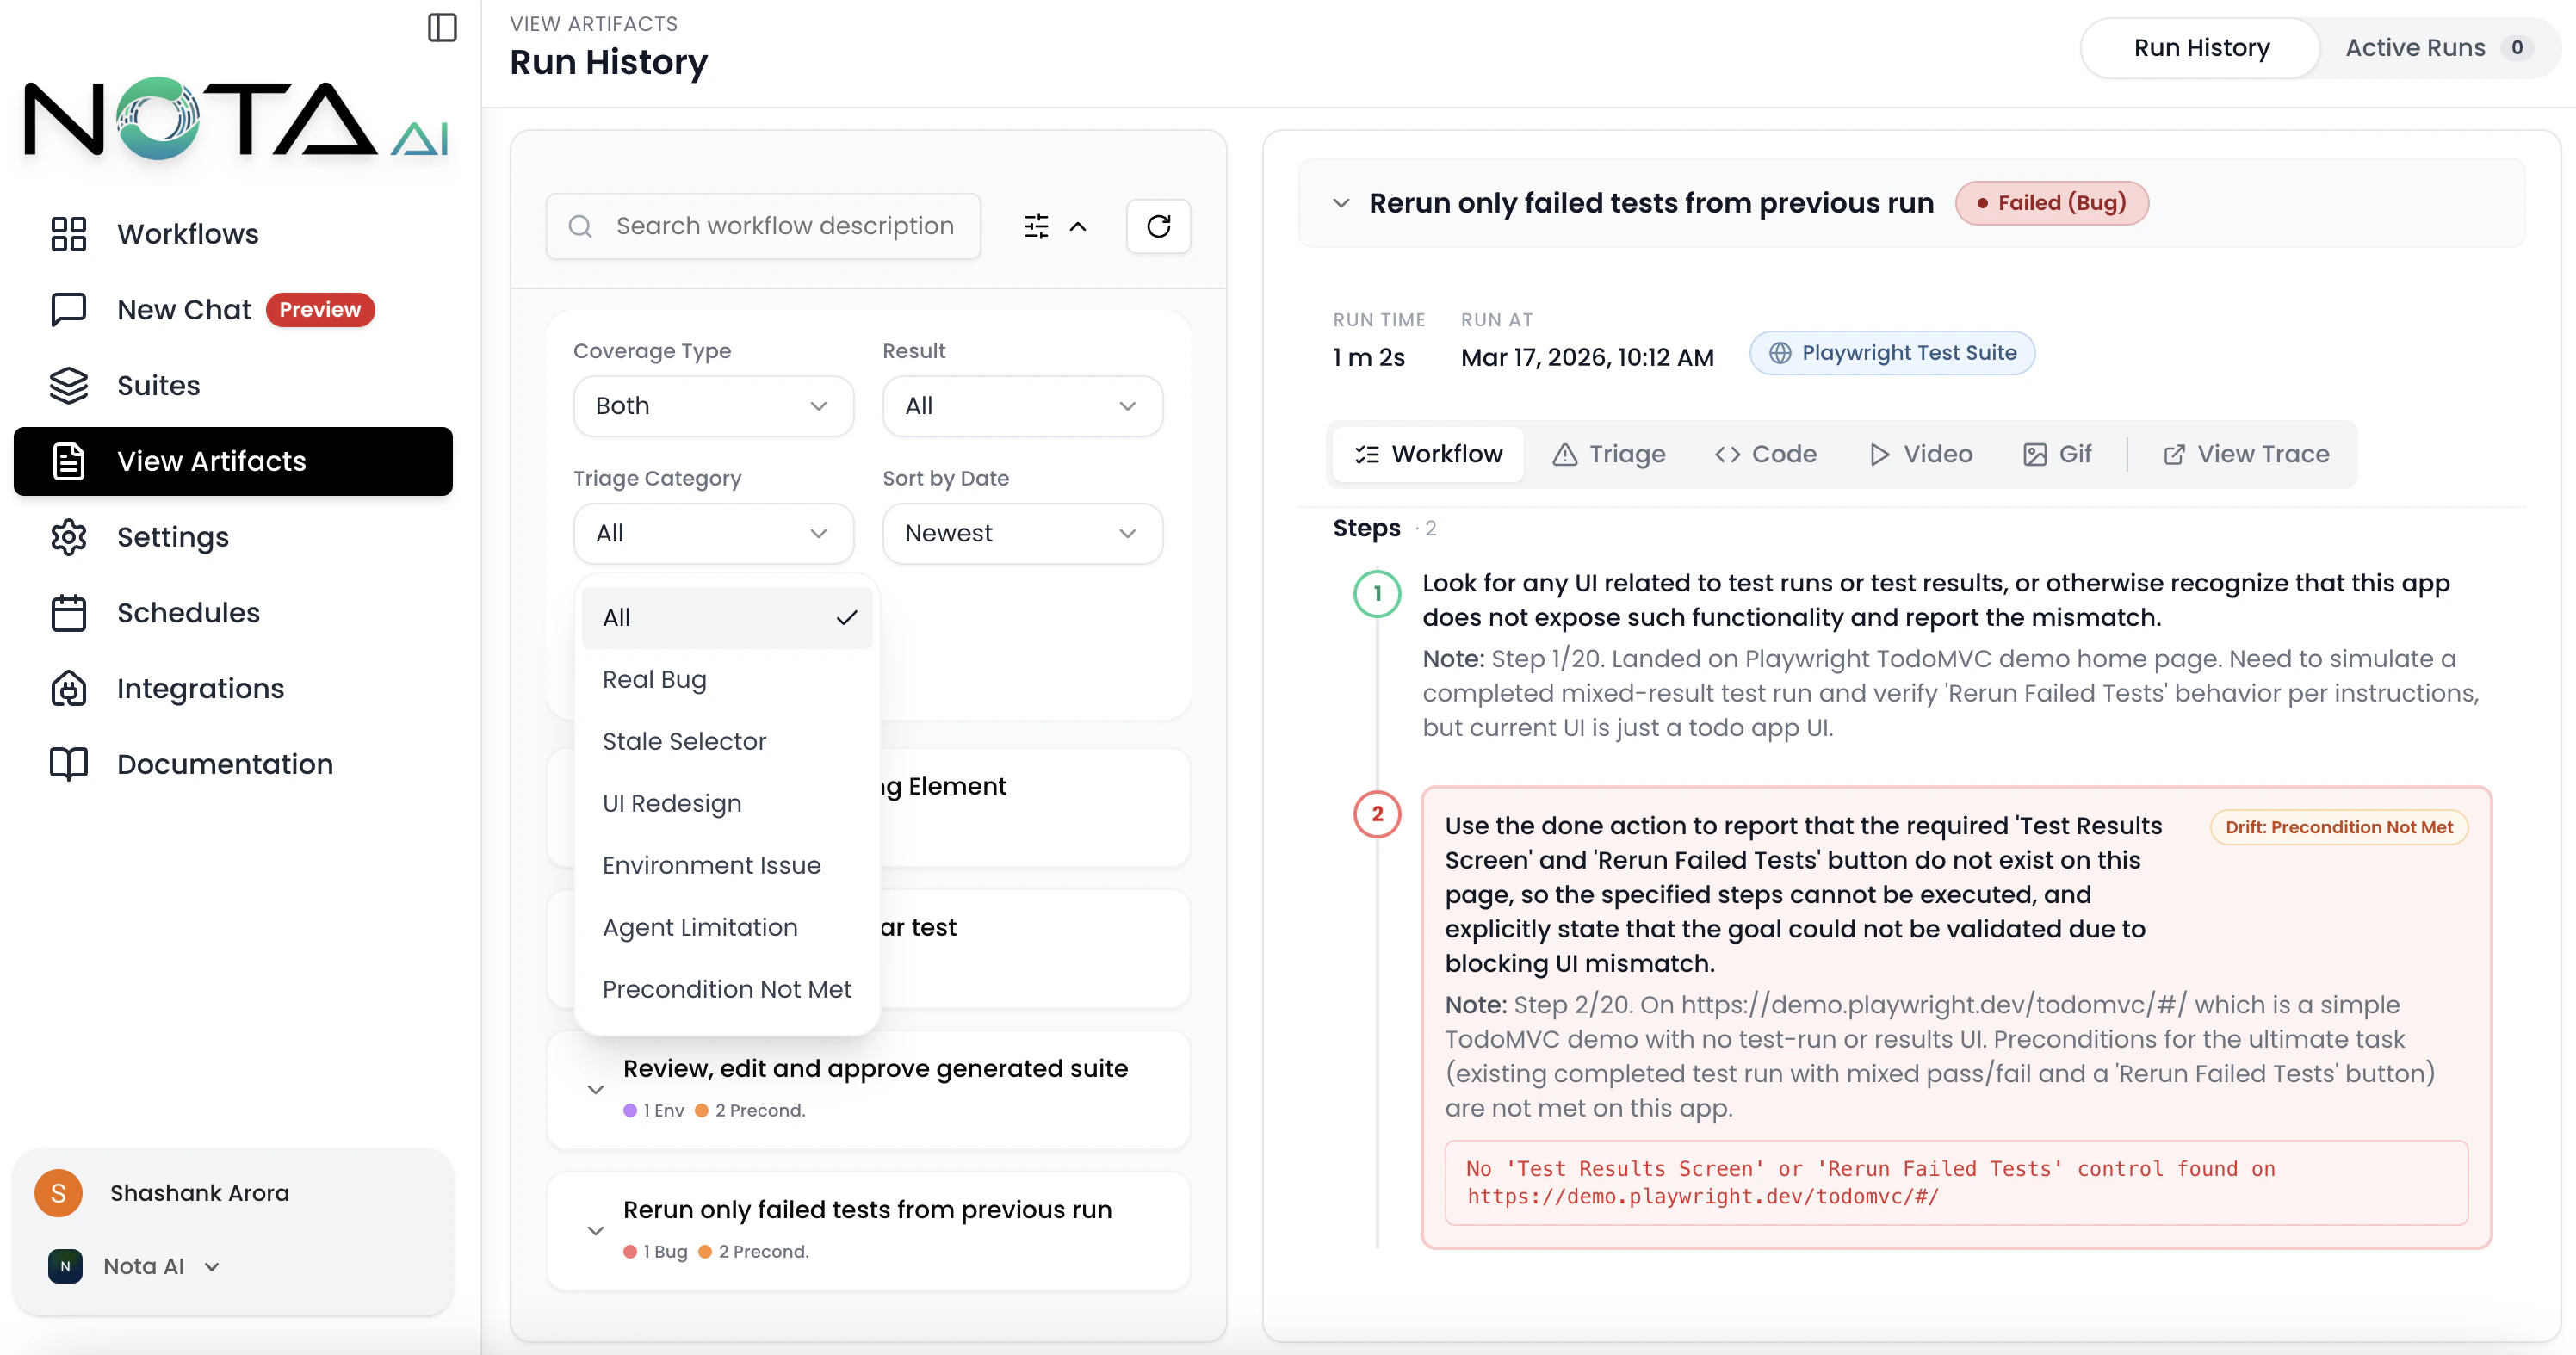
Sidebar Overview
The left sidebar on the Artifacts Overview page provides powerful organizational tools:-
Group by Workflow
Organize artifacts based on the workflow they belong to, making it easier to analyze test runs by functionality or module. -
Group by Date
View artifacts chronologically to track execution history and identify recent changes or regressions. -
Filters
Apply filters to narrow down artifacts by various criteria such as:
- Workflow name
- Result (Passed, Failed, Failed (Bug), Env Failure)
- Triage Category (Real Bug, Stale Selector, UI Redesign, Environment Issue, Agent Limitation, Precondition Not Met)
- Coverage created by
- Sort by date
- Triage Dots Each workflow group displays color-coded dots summarizing the triage breakdown of its failed runs, so you can spot patterns at a glance.
💡 Tip: Combining filters with grouping lets you drill down into specific workflows during a given timeframe or isolate failed test cases. Use the Triage Category filter to focus on real bugs and ignore environment-related noise.
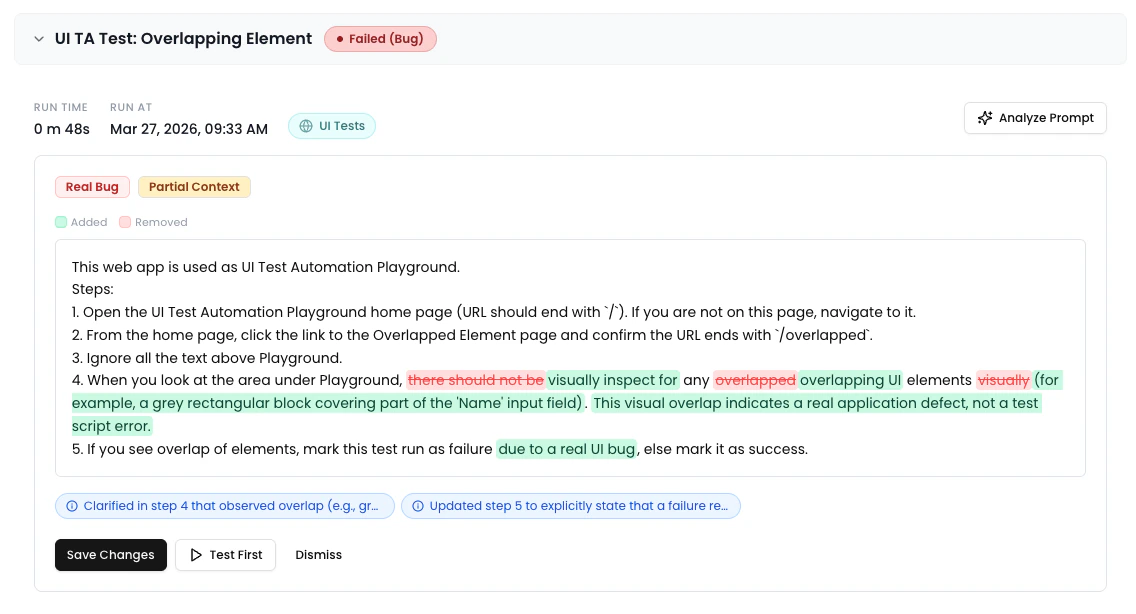
✨ Prompt Optimizer
When viewing a failed run, the run metadata bar displays an “Analyze Prompt” button. Clicking it triggers an AI analysis of the workflow prompt based on the failure context. The results appear in an inline Comparison Panel between the metadata bar and the artifact tabs, showing:- A word-level diff of the original vs. optimized prompt
- Severity-coded change pills (Breaking, Risk, Improvement)
- Context quality indicator and triage category badge
- Action buttons: Save Changes, Test First, or Dismiss
🧑💻 Code
Each executed workflow produces test case code—a representation of all the steps performed during automation.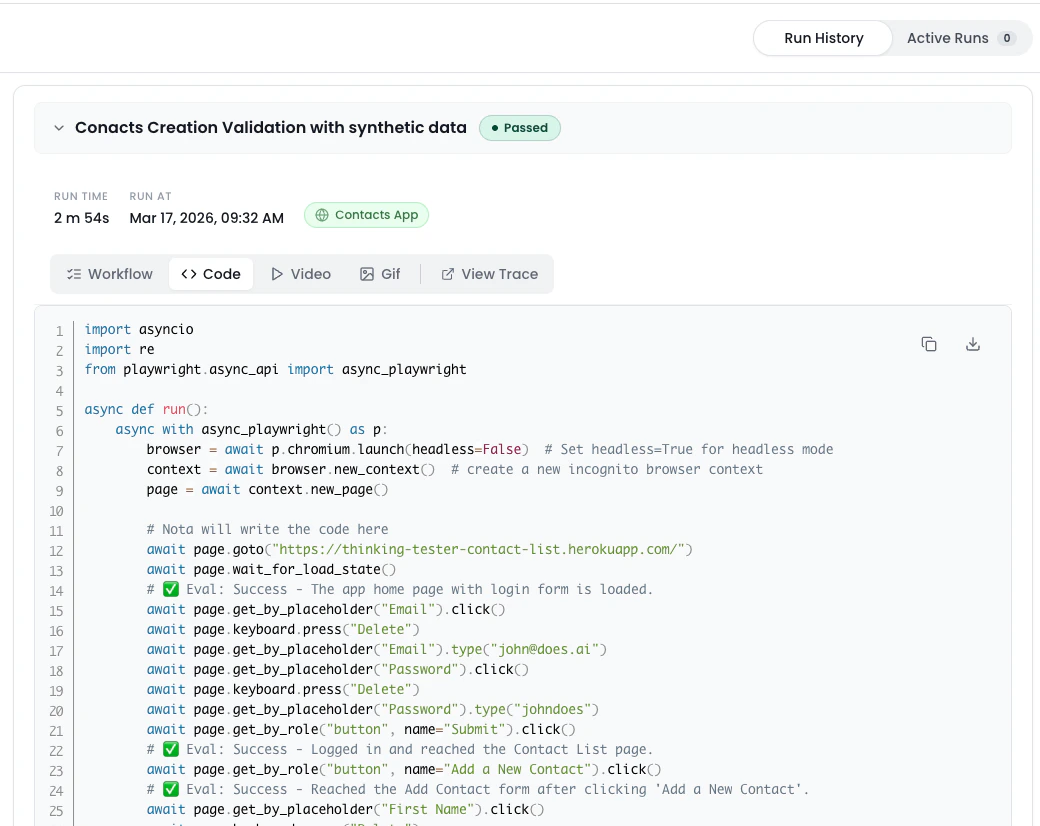
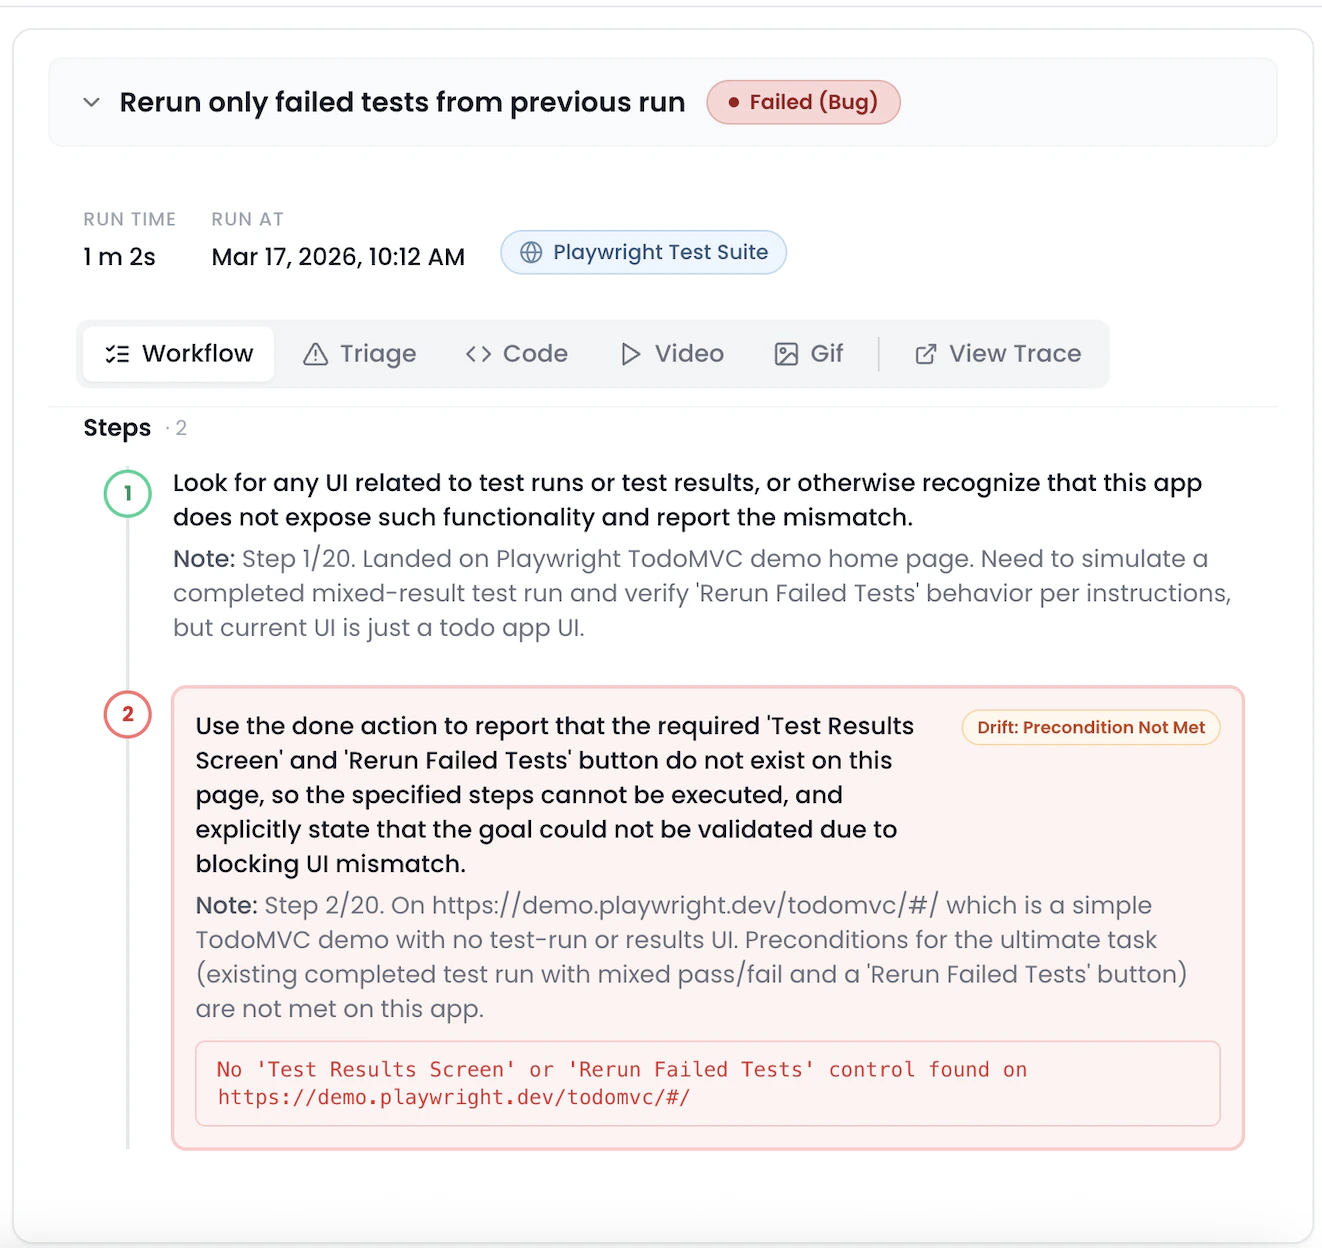
✅ Task Breakdown
The Task tab shows a step-by-step breakdown of the workflow as executed.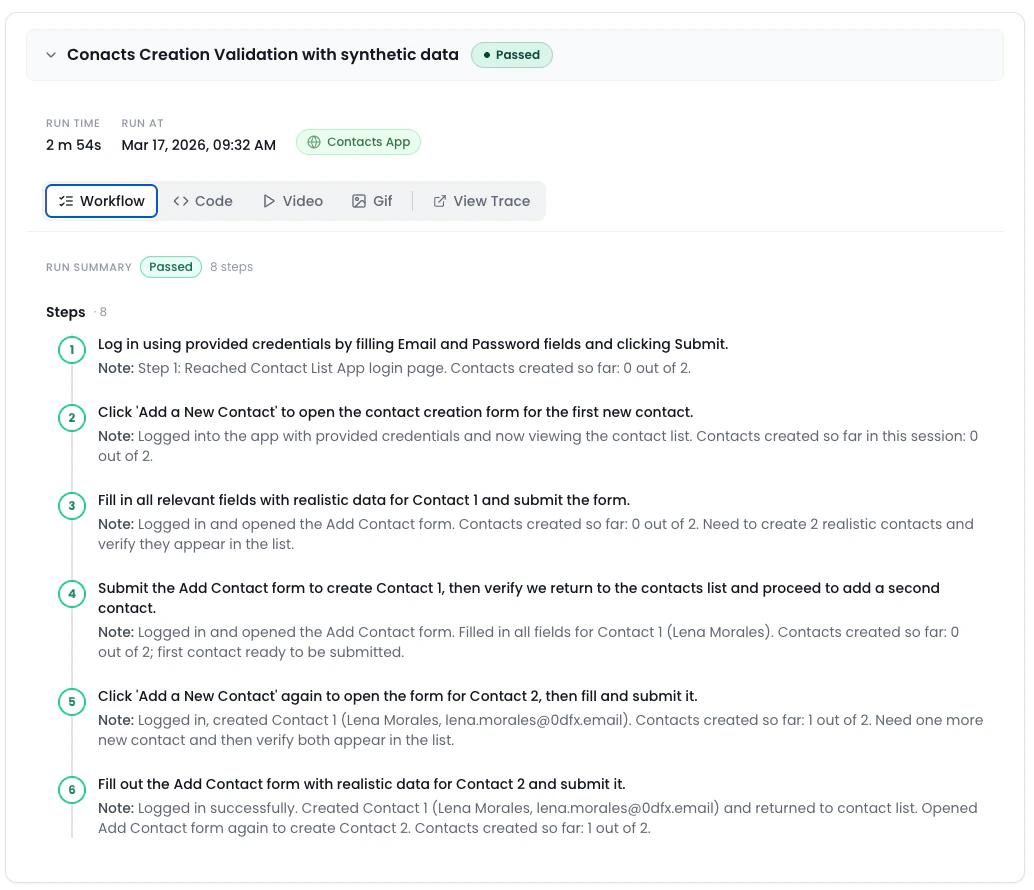
- Understand how the AI interpreted your prompt
- Pinpoint failures or unexpected behavior
- Errors are displayed within the interaction trace, so you can debug faster.
🎥 Video Playback
Nota records a video of the full test run for in-depth debugging. Use the video to:- Visually confirm test flow
- Share with your team
- Spot subtle UI issues
🖼 GIF Summary
For quick review or sharing, Nota also generates a compressed GIF of the test run.
- Pull request comments
- Slack/issue sharing
- Quick team updates
🗂 Trace File (trace.zip)
With every test you run, Nota AI gives you a full trace of execution—from raw test code to visual artifacts—so you can debug faster, share insights easily, and continuously improve your workflows. 🚀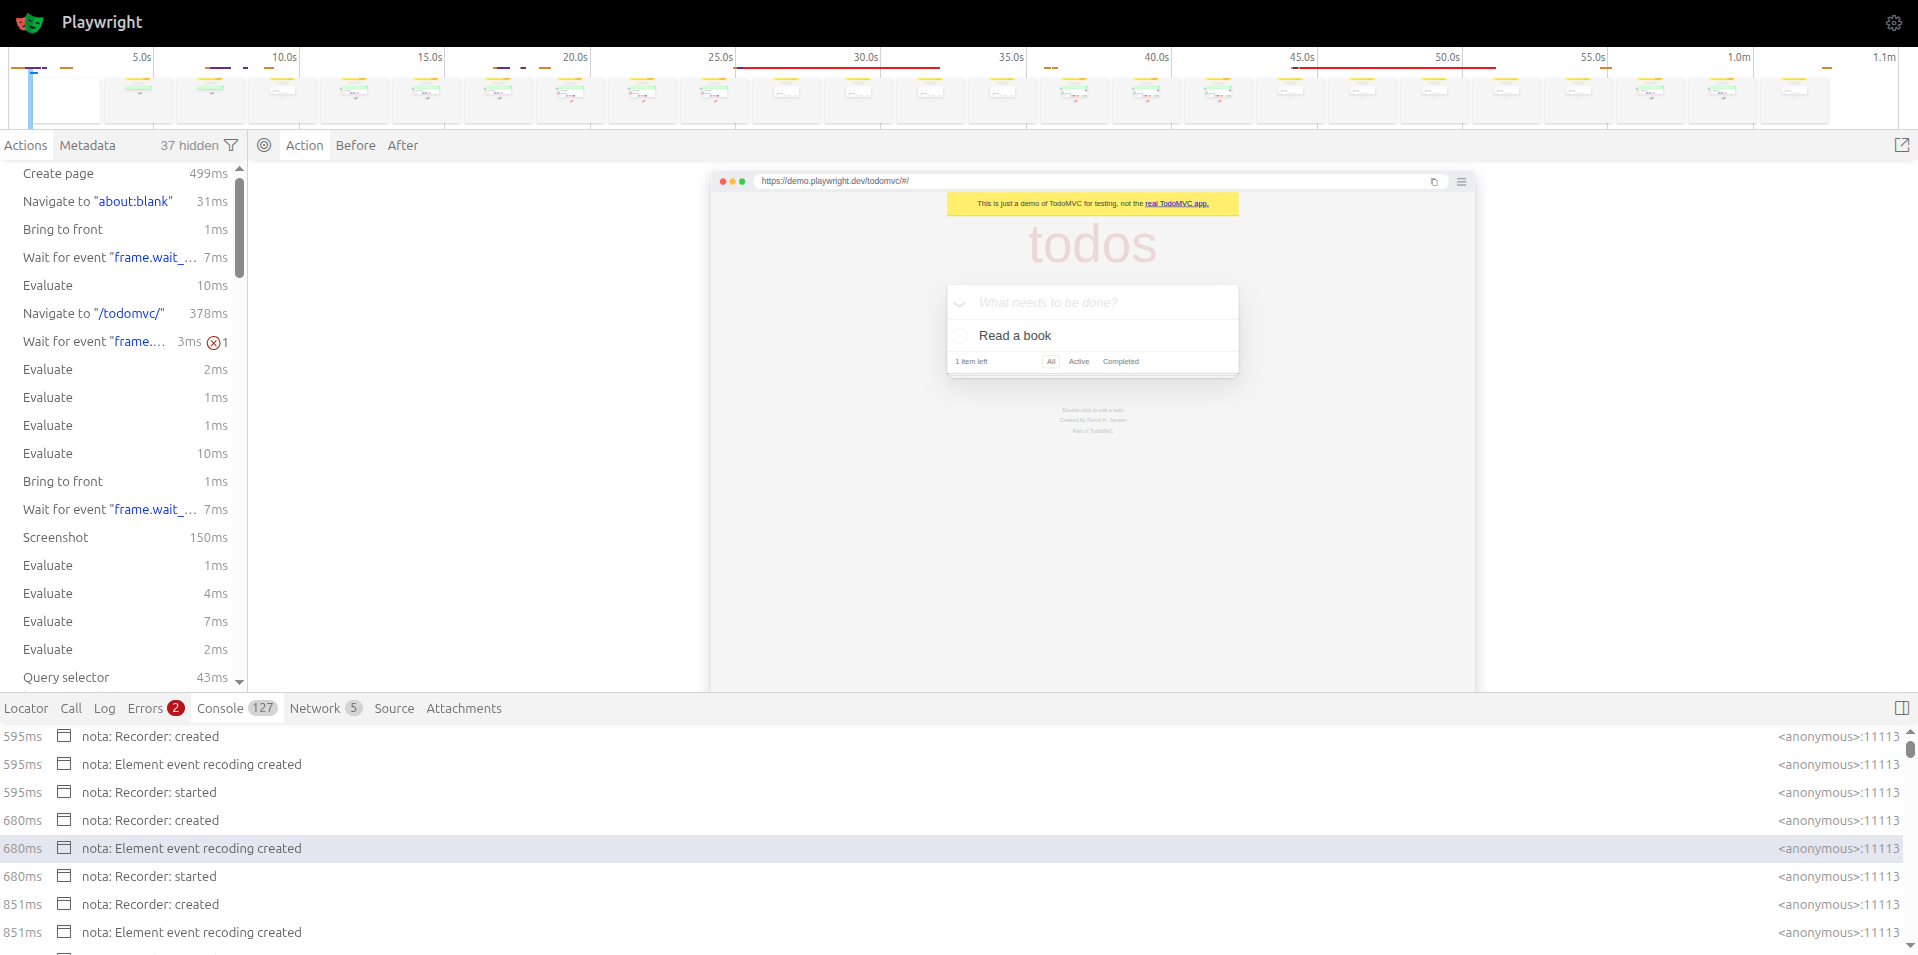
- Browser trace logs
- Screenshot snapshots (if applicable)
- Raw execution data
- You need a deeper debugging view
- Sharing detailed logs with teammates
- Integrating into CI/CD pipelines