> ## Documentation Index
> Fetch the complete documentation index at: https://docs.trynota.ai/llms.txt
> Use this file to discover all available pages before exploring further.
# Run History
> Review workflow artifacts to debug, analyze, and share test results.
# 📦 View Artifacts
Each time you execute a workflow in Nota AI, it generates **artifacts** that capture what happened during the test.\
These artifacts help developers and QA teams **debug, analyze, and share** results more effectively.
You’ll get:
* **Test case code** — the generated automation script
* **Task breakdown** — a step-by-step view of what happened
* **Video and GIF recordings** — to visually verify test execution
* Downloadable trace archive (`trace.zip`)
***
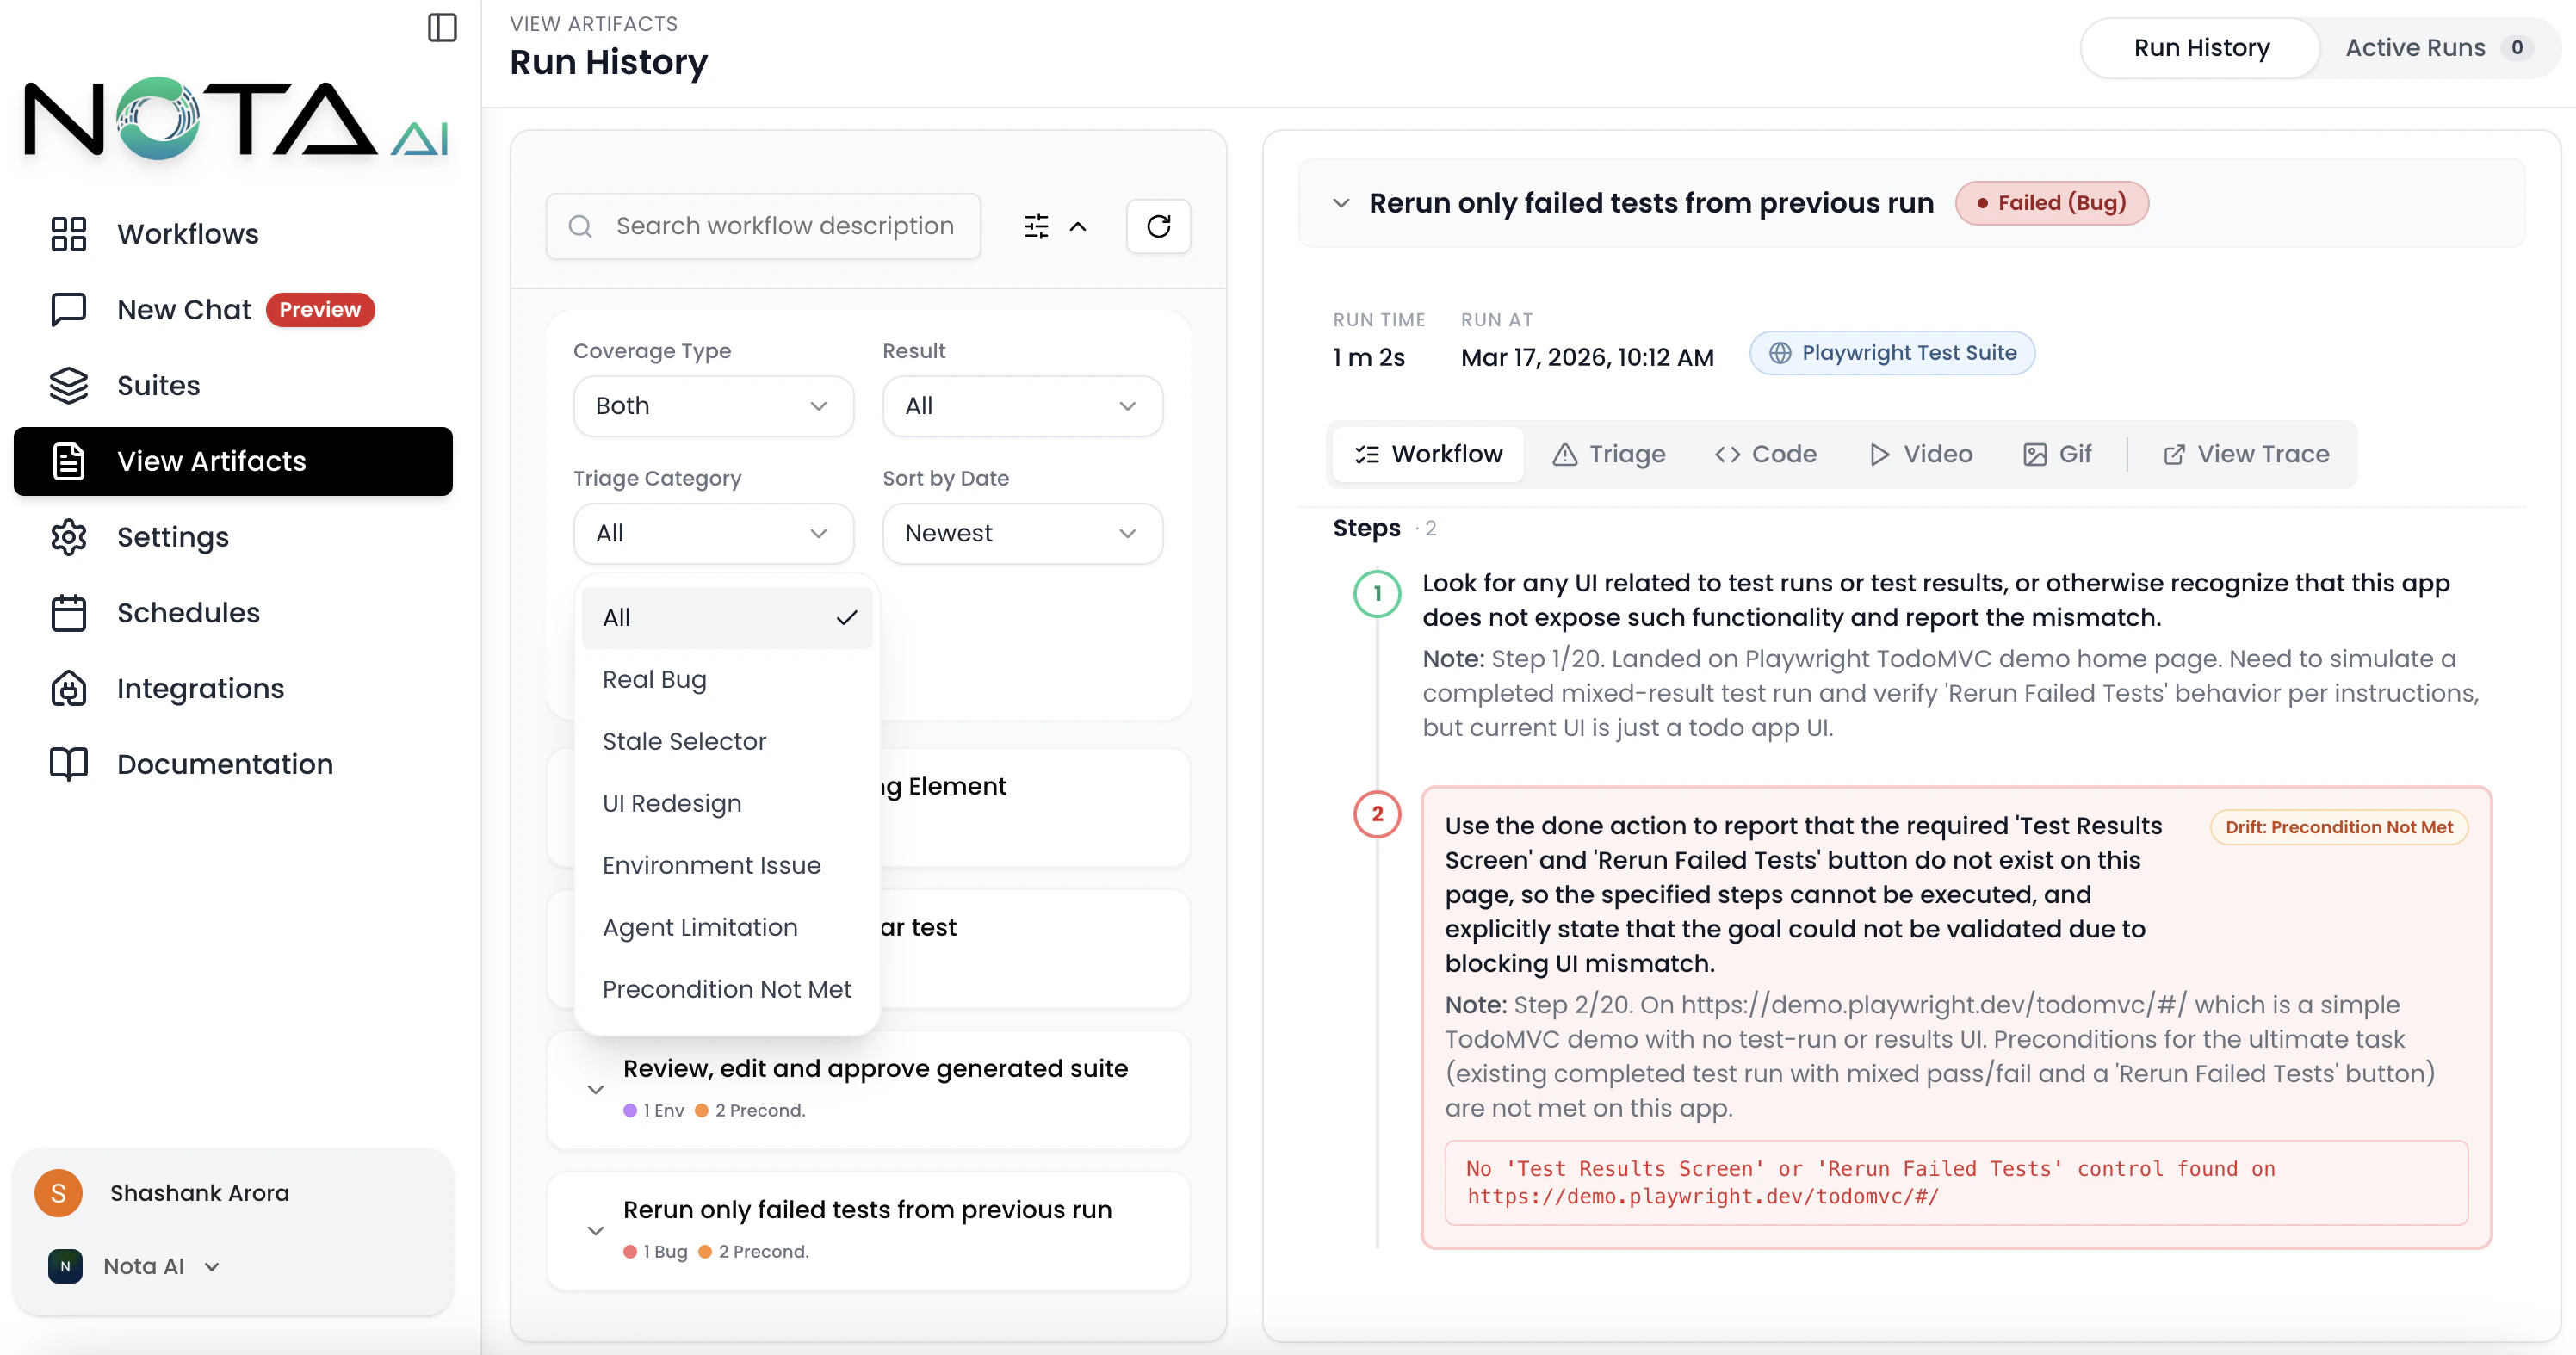
## Sidebar Overview
The left sidebar on the Artifacts Overview page provides powerful organizational tools:
* **Group by Workflow**\
Organize artifacts based on the workflow they belong to, making it easier to analyze test runs by functionality or module.
* **Group by Date**\
View artifacts chronologically to track execution history and identify recent changes or regressions.
* **Filters**
Apply filters to narrow down artifacts by various criteria such as:
* Workflow name
* Result (Passed, Failed, Failed (Bug), Env Failure)
* [Triage Category](/view-artifacts/triage) (Real Bug, Stale Selector, UI Redesign, Environment Issue, Agent Limitation, Precondition Not Met)
* Coverage created by
* Sort by date
* **Triage Dots**
Each workflow group displays color-coded dots summarizing the triage breakdown of its failed runs, so you can spot patterns at a glance.
> 💡 Tip: Combining filters with grouping lets you drill down into specific workflows during a given timeframe or isolate failed test cases. Use the Triage Category filter to focus on real bugs and ignore environment-related noise.
***
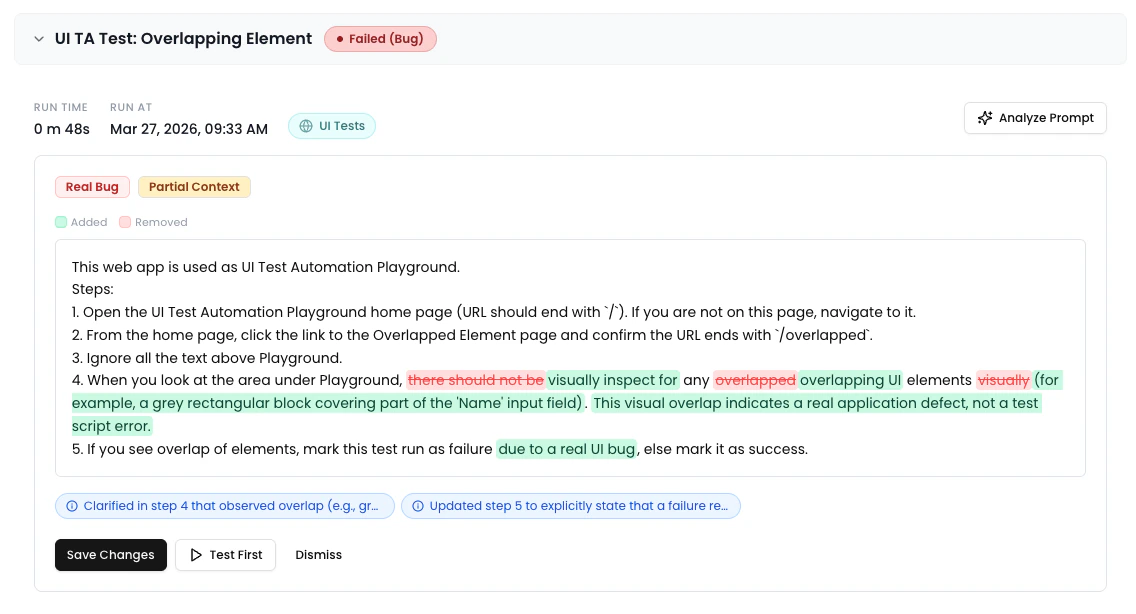
## ✨ Prompt Optimizer
When viewing a **failed run**, the run metadata bar displays an **"Analyze Prompt"** button. Clicking it triggers an AI analysis of the workflow prompt based on the failure context.
The results appear in an inline **Comparison Panel** between the metadata bar and the artifact tabs, showing:
* A word-level **diff** of the original vs. optimized prompt
* Severity-coded **change pills** (Breaking, Risk, Improvement)
* **Context quality** indicator and **triage category** badge
* Action buttons: **Save Changes**, **Test First**, or **Dismiss**
For full details, see the [Prompt Optimizer](/view-artifacts/prompt-optimizer) page.
***
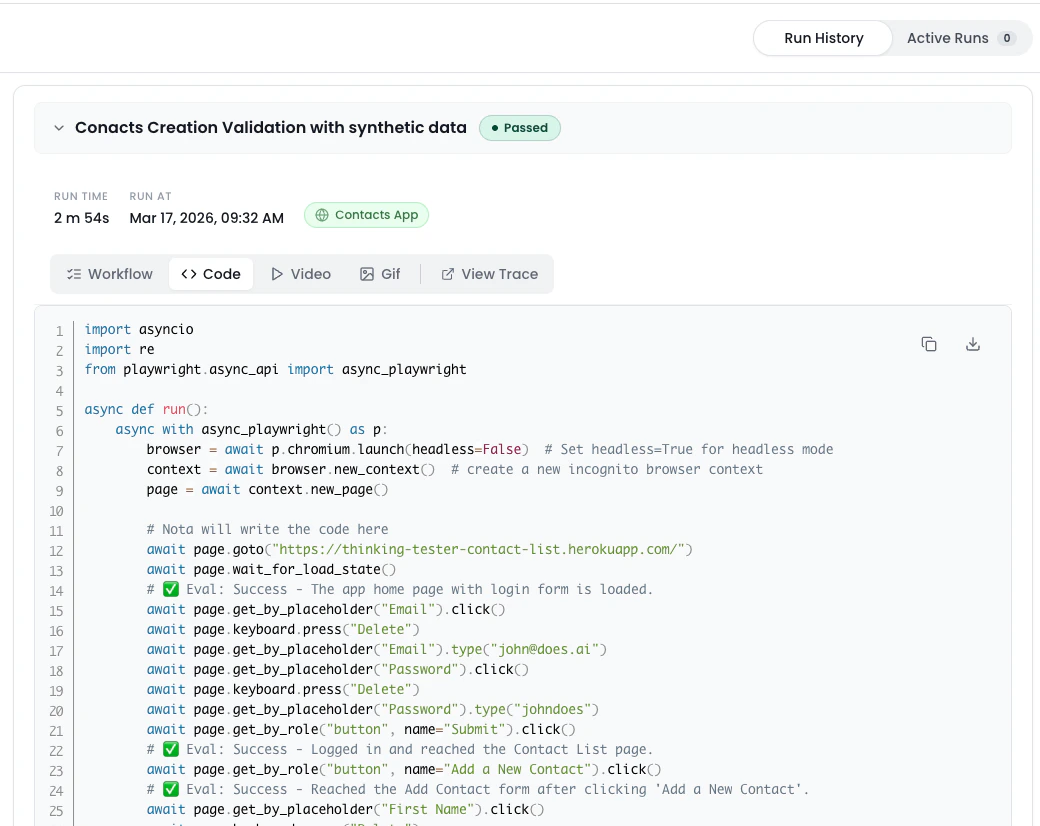
## 🧑💻 Code
Each executed workflow produces **test case code**—a representation of all the steps performed during automation.
You can **copy**, **download**, **modify**, or **reuse** this code across your own automation suite.
***
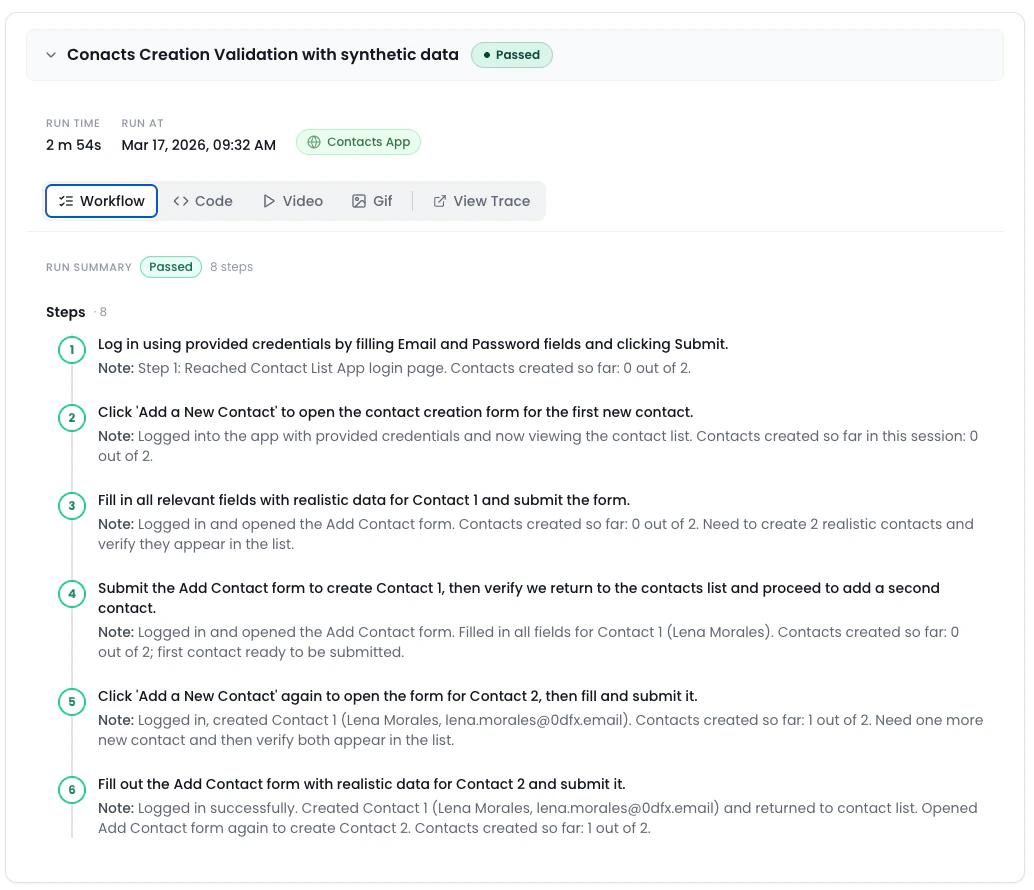
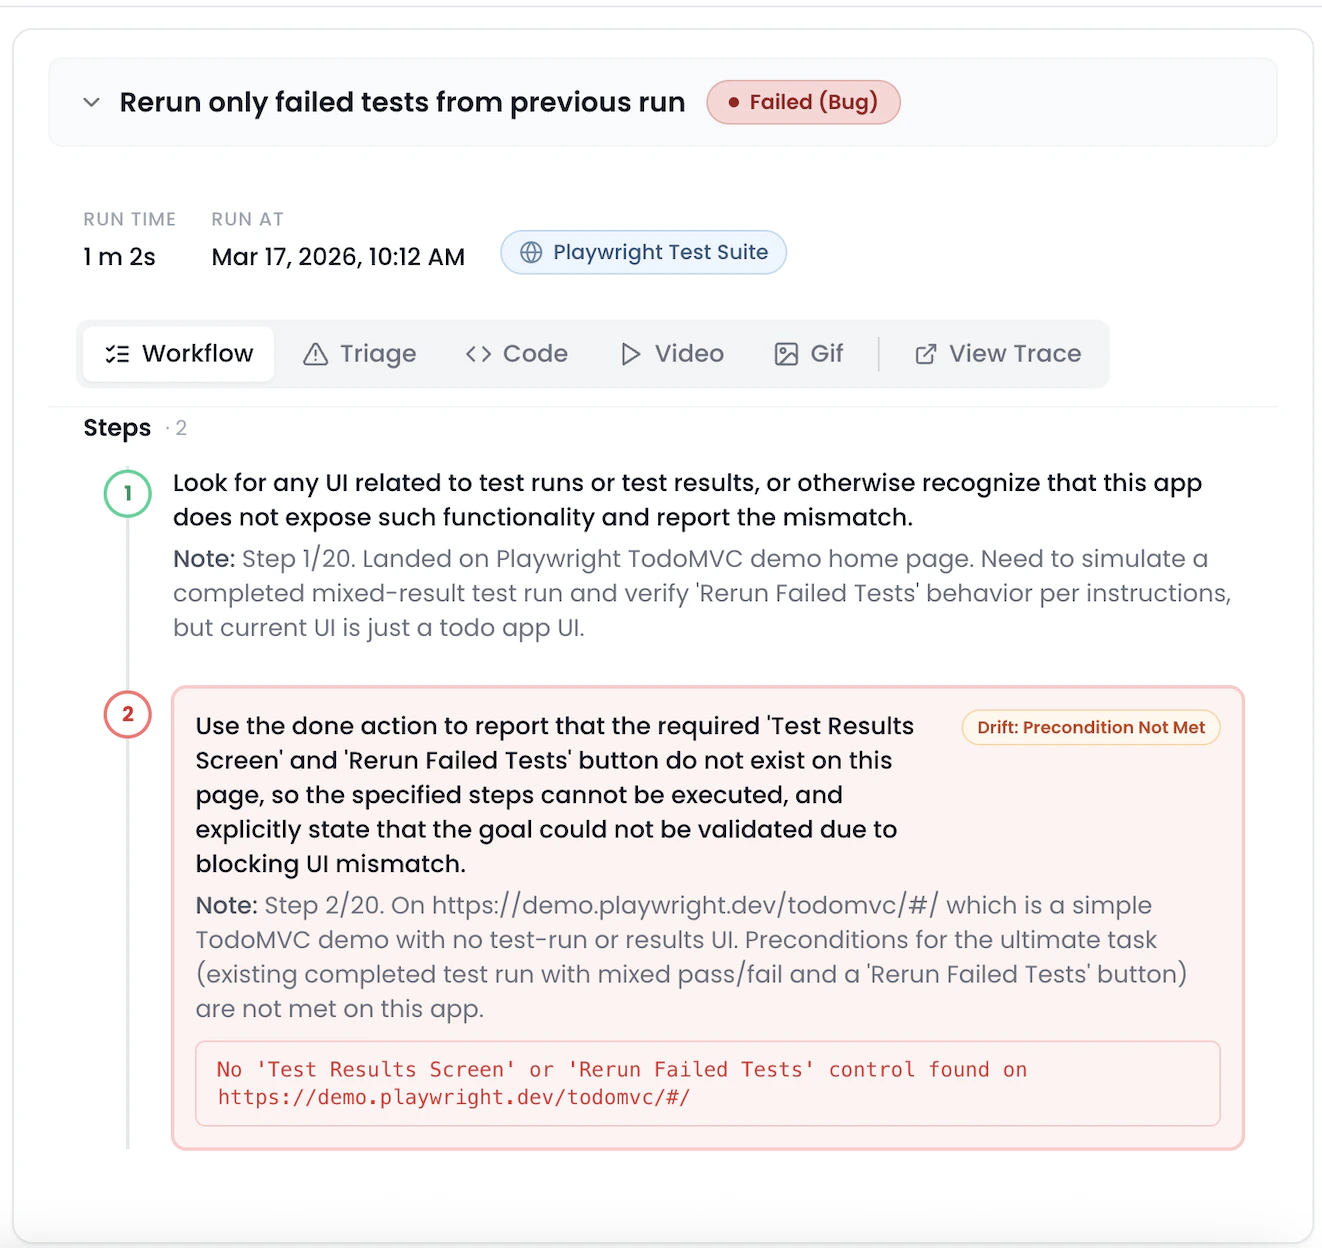
## ✅ Task Breakdown
The **Task** tab shows a **step-by-step breakdown** of the workflow as executed.
This helps you:
* Understand how the AI interpreted your prompt
* Pinpoint failures or unexpected behavior
⚠️ Inline Error Display
See exactly where and why the agent encountered errors — inline and in context.
* Errors are displayed within the interaction trace, so you can debug faster.
***
## 🎥 Video Playback
Nota records a **video** of the full test run for in-depth debugging.
Use the video to:
* Visually confirm test flow
* Share with your team
* Spot subtle UI issues
***
## 🖼 GIF Summary
For quick review or sharing, Nota also generates a **compressed GIF** of the test run.
Perfect for:
* Pull request comments
* Slack/issue sharing
* Quick team updates
***
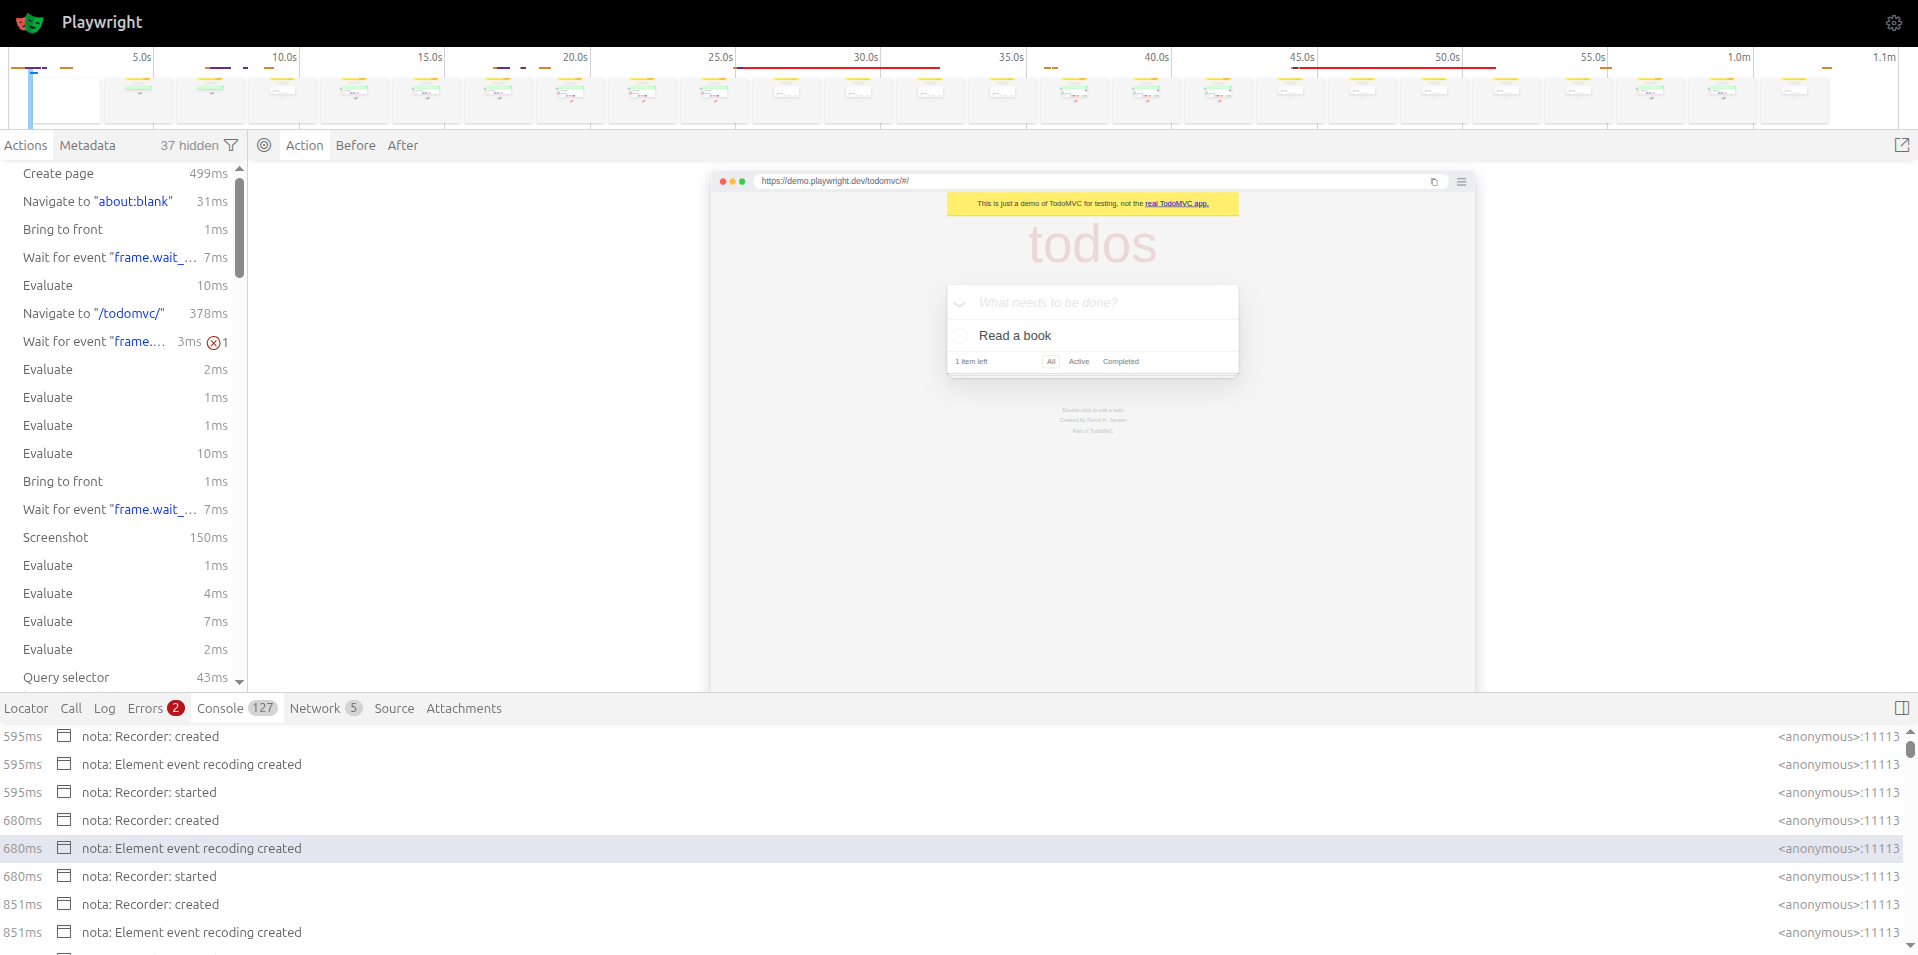
## 🗂 Trace File (trace.zip)
With every test you run, Nota AI gives you a **full trace of execution**—from raw test code to visual artifacts—so you can debug faster, share insights easily, and continuously improve your workflows. 🚀
This archive includes:
* Browser trace logs
* Screenshot snapshots (if applicable)
* Raw execution data
Use this when:
* You need a deeper debugging view
* Sharing detailed logs with teammates
* Integrating into CI/CD pipelines
 ***
## ✨ Prompt Optimizer
When viewing a **failed run**, the run metadata bar displays an **"Analyze Prompt"** button. Clicking it triggers an AI analysis of the workflow prompt based on the failure context.
The results appear in an inline **Comparison Panel** between the metadata bar and the artifact tabs, showing:
* A word-level **diff** of the original vs. optimized prompt
* Severity-coded **change pills** (Breaking, Risk, Improvement)
* **Context quality** indicator and **triage category** badge
* Action buttons: **Save Changes**, **Test First**, or **Dismiss**
For full details, see the [Prompt Optimizer](/view-artifacts/prompt-optimizer) page.
***
## ✨ Prompt Optimizer
When viewing a **failed run**, the run metadata bar displays an **"Analyze Prompt"** button. Clicking it triggers an AI analysis of the workflow prompt based on the failure context.
The results appear in an inline **Comparison Panel** between the metadata bar and the artifact tabs, showing:
* A word-level **diff** of the original vs. optimized prompt
* Severity-coded **change pills** (Breaking, Risk, Improvement)
* **Context quality** indicator and **triage category** badge
* Action buttons: **Save Changes**, **Test First**, or **Dismiss**
For full details, see the [Prompt Optimizer](/view-artifacts/prompt-optimizer) page.
 ***
## 🧑💻 Code
Each executed workflow produces **test case code**—a representation of all the steps performed during automation.
***
## 🧑💻 Code
Each executed workflow produces **test case code**—a representation of all the steps performed during automation.
 You can **copy**, **download**, **modify**, or **reuse** this code across your own automation suite.
***
## ✅ Task Breakdown
The **Task** tab shows a **step-by-step breakdown** of the workflow as executed.
You can **copy**, **download**, **modify**, or **reuse** this code across your own automation suite.
***
## ✅ Task Breakdown
The **Task** tab shows a **step-by-step breakdown** of the workflow as executed.
 This helps you:
* Understand how the AI interpreted your prompt
* Pinpoint failures or unexpected behavior
⚠️ Inline Error Display
See exactly where and why the agent encountered errors — inline and in context.
* Errors are displayed within the interaction trace, so you can debug faster.
This helps you:
* Understand how the AI interpreted your prompt
* Pinpoint failures or unexpected behavior
⚠️ Inline Error Display
See exactly where and why the agent encountered errors — inline and in context.
* Errors are displayed within the interaction trace, so you can debug faster.
 ***
## 🎥 Video Playback
Nota records a **video** of the full test run for in-depth debugging.
Use the video to:
* Visually confirm test flow
* Share with your team
* Spot subtle UI issues
***
## 🖼 GIF Summary
For quick review or sharing, Nota also generates a **compressed GIF** of the test run.
***
## 🎥 Video Playback
Nota records a **video** of the full test run for in-depth debugging.
Use the video to:
* Visually confirm test flow
* Share with your team
* Spot subtle UI issues
***
## 🖼 GIF Summary
For quick review or sharing, Nota also generates a **compressed GIF** of the test run.
 Perfect for:
* Pull request comments
* Slack/issue sharing
* Quick team updates
***
## 🗂 Trace File (trace.zip)
With every test you run, Nota AI gives you a **full trace of execution**—from raw test code to visual artifacts—so you can debug faster, share insights easily, and continuously improve your workflows. 🚀
Perfect for:
* Pull request comments
* Slack/issue sharing
* Quick team updates
***
## 🗂 Trace File (trace.zip)
With every test you run, Nota AI gives you a **full trace of execution**—from raw test code to visual artifacts—so you can debug faster, share insights easily, and continuously improve your workflows. 🚀
 This archive includes:
* Browser trace logs
* Screenshot snapshots (if applicable)
* Raw execution data
Use this when:
* You need a deeper debugging view
* Sharing detailed logs with teammates
* Integrating into CI/CD pipelines
This archive includes:
* Browser trace logs
* Screenshot snapshots (if applicable)
* Raw execution data
Use this when:
* You need a deeper debugging view
* Sharing detailed logs with teammates
* Integrating into CI/CD pipelines